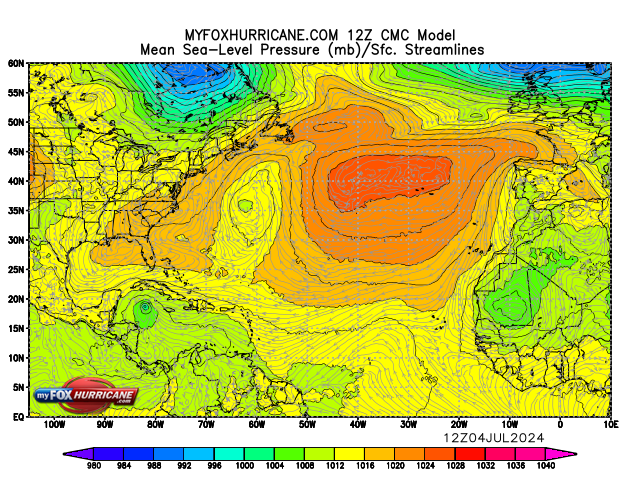
CMC Model | Mean Sea Level Pressure

CMC Model Description
The Canadian Meteorological Center (CMC) produces a global computerized weather forecast model twice daily. The CMC model is global, as opposed to, the GFDL and WRF models which are regional models centered over North America. The CMC model is run through 240 hours.
The graphic above shows the barometric pressure field over the entire Atlantic hurricane basin. Lower pressures are indicated in dark blue. Higher pressures are indicated in red. Hurricanes and tropical storms, as well as non-tropical low-pressure areas, are associated with low pressure (blue). The black lines are isobars (lines of equal pressure). The closer the lines are to each other, the stronger the winds. The lighter gray lines with arrowheads are known as streamlines. These lines indicated the direction of flow of air at the surface. The spacing of these lines does not indicate the strength of the wind.
Remember that these are mathematical models with varying initial assumptions. Thus, different models produce different final results. They do not necessarily reflect the "official" hurricane track issued by the National Hurricane Center. Forecasters review all of the model data but use their own experience and scientific expertise to arrive at a final forecast.
Additional Weather Maps
-

Sea Surface Temp-Anom | Caribbean
-
CMC Model Accum. Precip. | Atlantic
-
CMC Model Pressure | Caribbean
-
CMC Model Accum. Precip. | Caribbean


Storm Preparation Guide
county-by-county pages
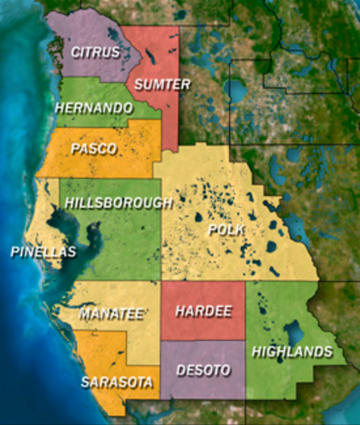 Click on your county above for specific evacuation zones, and emergency contacts.